
Five ways today's market cycle differs from the dot-com era
Review the latest Weekly Headings by CIO Larry Adam.
Key takeaways:
- The US economic picture is quite different from the heady days of 1997-2000
- In contrast to the dot-com era, today’s tech sector leaders are profitable
- While mega-sized IPOs grab headlines, overall IPO activity is historically moderate
With tech stocks pushing to new highs on enthusiasm around transformational technologies, the real question isn’t just momentum. It’s whether markets are becoming frothy, even bubble‑like, reminiscent of the dot‑com era. We don’t think so. The momentum may rhyme, but the foundation is stronger. Today’s tech leaders, including those in our MAGMAN* composite, are highly profitable businesses. That’s a sharp contrast to the late‑1990s darlings, which often had little to no earnings and, in some cases, no revenue at all. While the setup may feel familiar, the fundamentals are very different. Below are five ways this cycle stands apart.
Fundamentals remain supportive
The tech sector has had a strong run – up ~24% year to date – backed by solid fundamentals. Earnings are on track to rise 47% year over year in 2026, following 20%+ growth in both 2024 and 2025. While tech earnings followed a similar path in 1999, jumping over 50%, they quickly faded as revenue growth slowed to just 8% in 2000 and turned negative in 2001.
Today, the key difference is visibility. Ongoing demand for AI and the semiconductor investment cycle point to a more durable growth path, with consensus still expecting ~30% earnings-per-share growth next year. And with margins near all-time highs – about three times late-1990s levels – we expect earnings to remain a sustained tailwind for the sector. With earnings growth outpacing price performance year to date, valuations have become more attractive.
The US economy isn’t overheating
The US economy is tracking toward 2.4% growth in 2026, solid compared to other developed markets but far from “overheating.” With growth steady and the labor market stabilizing after a soft patch in late 2025, the Federal Reserve (Fed) has little urgency to tighten policy – we believe it is more likely on a prolonged pause – despite some near-term inflation pressure from tariffs and oil. That’s a sharp contrast to the late 1990s when growth ran above 4% from 1997 to 2000 and the Fed raised rates by 175 basis points between June 1999 and May 2000. That rapid tightening became a key catalyst in the unwind of the dot-com bubble.
Speculation is not rampant
With the tech‑heavy Nasdaq up ~40% over the past year, it’s natural to question whether momentum is getting stretched. But today’s environment still falls well short of the extremes seen in 1999. At the peak of the dot‑com bubble, the Nasdaq surged more than 114% year over year, with ~20% of its components rising more than 200%.
Today, that figure is just 6%. Just as important, the nature of speculation is very different. In 1999, markets rewarded “clicks over profits,” with companies like Pets.com symbolizing a willingness to chase growth without a clear path to earnings. Valuations reflected that disconnect, with the NASDAQ trading above 100x trailing earnings. Today, valuations are closer to ~32x, much more in line with recent five-year averages. In other words, while momentum is strong, market conditions remain far more grounded than during the late‑1990s cycle.
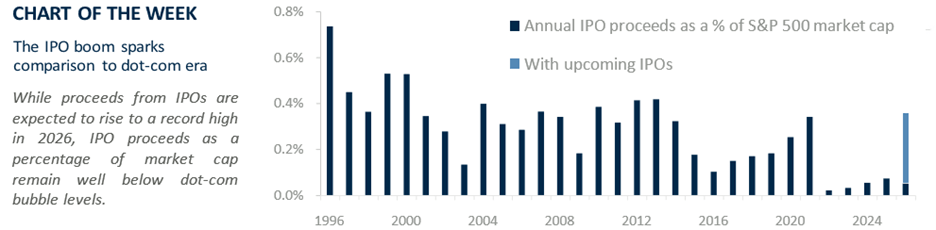
Upcoming IPOs are not a redux of 1999
The late 1990s saw a surge in IPOs, many from speculative companies with little to no revenue. Around 500 US companies went public in 1999, compared to just 90 in 2025. A new wave of tech IPOs – names like SpaceX, Anthropic and OpenAI – could rank among the largest ever, raising echoes of the dot‑com era. But the backdrop is very different.
Even if total IPO proceeds top $250 billion this year – well above the $137 billion peak in 2021 – IPO activity as a share of market cap is roughly half of late‑1990s levels (0.3% vs. 0.6%). At the same time, the market is better equipped to absorb new supply, supported by faster index inclusion – potentially within five days for Russell indices and 15 days for the Nasdaq – and the surge in passive investing, with AUM growing from $389 billion in 1999 to $19 trillion today. Just as importantly, companies are coming public at a more mature stage, with the average time to IPO extending to ~12 years from about four years in 1999.
AI is more of an evolution rather than a revolution
Technology today is far more deeply embedded in both daily life and the broader economy than it was in the late 1990s. Back then, US computer penetration didn’t even exceed 50% until 2000, and many households still lacked internet access. Learning to use computers and then navigate the internet required a meaningful behavioral shift, and that took time.
By contrast, AI is being layered onto an already digital world. Using AI to access and analyze information is more incremental, closer to adding new functionality like a new app to enhance what you already do, rather than starting from scratch. And because these tools are being built directly into familiar platforms, adoption is happening more seamlessly and with broad business investment and support across a wide spectrum of industries. The result? A faster uptake and a smoother adoption curve, supporting a more durable growth path than the boom‑bust cycle of the late 1990s.
*MAGMAN represents a composite of Microsoft, Apple, Google, Meta, Amazon, Nvidia.
All expressions of opinion reflect the judgment of the author(s) and the Investment Strategy Committee and are subject to change. This information should not be construed as a recommendation. The foregoing content is subject to change at any time without notice. Content provided herein is for informational purposes only. There is no guarantee that these statements, opinions or forecasts provided herein will prove to be correct. Past performance is not a guarantee of future results. Indices and peer groups are not available for direct investment. Any investor who attempts to mimic the performance of an index or peer group would incur fees and expenses that would reduce returns. No investment strategy can guarantee success.
Economic and market conditions are subject to change. Investing involves risks including the possible loss of capital.
The information has been obtained from sources considered to be reliable, but we do not guarantee that the foregoing material is accurate or complete. Diversification and asset allocation do not ensure a profit or protect against a loss.
The S&P 500 Total Return Index: The index is widely regarded as the best single gauge of large-cap U.S. equities. There is over USD 7.8 trillion benchmarked to the index, with index assets comprising approximately USD 2.2 trillion of this total. The index includes 500 leading companies and captures approximately 80% coverage of available market capitalization.
Sector investments are companies focused on a specific economic sector and are presented here for illustrative purposes only. Sectors, including technology, are subject to varying levels of competition, economic sensitivity, and political and regulatory risks. Investing in any individual sector involves limited diversification.
